In the world of cryptocurrency, history doesn’t just repeat; it rhymes. When Bitcoin’s price dances on the chart, it seems to be driven not only by random emotions and news but by following an ancient yet mysterious script. This script, we call it the “market cycle.” Today, let’s peel back the layers and see how a seasoned trader is interpreting the grand play currently unfolding, and as participants, how we should navigate the potential ultimate carnival.

The Echo of History: Bitcoin’s “August High, September Low” Playbook
Have you ever noticed a stunningly repetitive pattern in Bitcoin’s history? Whenever a major bull market cycle nears its end, a seemingly fixed rhythm tends to emerge:
- August/Early September: The market hits a significant local top, sentiment peaking.
- September: The market experiences a significant correction, forming an important low.
- Q4: On the back of that low, the market enters the final and most powerful wave, surging towards the cycle’s peak.
This isn’t mere speculation; it’s a trackable historical fact:
- 2013: The same pattern played out: a top in August, a dip in September, followed by an epic bull run.
- 2017: A classic replay, with a high in August, a base in September, and a soaring Q4.
- 2020: Even amidst the black swan event of a global pandemic, this pattern held strong.
- Last Cycle (2021): A high in early September, a low in late September, setting the stage for the ultimate top in November.
The reason this pattern is so captivating is that it acts like a trailer, revealing the main plot of the script in advance. The current market appears to be replaying this exact scenario. We’ve already seen the August peak and the subsequent September action. The chorus of “this time is different” rings hollow in the face of such historical evidence. Mr. Market seems to be calmly and efficiently telling every participant, “The script is already written; please take your seats.”
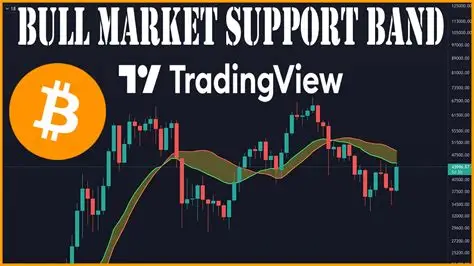
The Current Battleground: The Decisive Test of the 20-Week MA
Understanding the historical playbook, let’s refocus on the present. Bitcoin is currently at a critical technical crossroads: the 20-week Moving Average (20-week SMA). In the last few cycles, this line has been seen as a lifeline to market strength.
Interestingly, the analyst points out that in the current cycle, Bitcoin seems to respect the 50-week Moving Average more than the 20-week. This means that as long as the weekly close remains above the 50-week MA (currently around the $99K level, approaching the psychological $100K mark), the grand narrative of this bull cycle remains un-falsified. This gives us a very important “safety net.”
However, the immediate test is still the 20-week MA, also referred to as the “Bull Market Support Band”. If Bitcoin can hold this level firmly, it will likely replicate the 2020 classic: forming a bottom in September and launching a sharper rally in Q4. We must prepare for two scenarios:
Best Case: Bitcoin finds strong support at the 20-week MA, holds, and bounces. This is a sign of a healthy market and lays a solid foundation for the “Q4 carnival.”
Contingency Case: The price breaks below the 20-week MA and dips down to test the 50-week MA. As long as the weekly close doesn’t break below the 50-week, the cycle isn’t over, but it would signal a more painful consolidation process, potentially dragging on for longer.
The $12,400 Mark: A Mysterious Top Code?
If historical analysis and technical indicators represent the rational left-brain approach, then the coincidences in certain numbers are like mysterious right-brain intuitions. The analyst highlights a magical number: $12,400.
Look back at history with a keen eye, and you’ll be startled by this number’s “accuracy”:
- 2013 Bull Market Top: $12,440.
- 2020 Local High: $12,400.
When we extrapolate this pattern to today, a compelling projection emerges: $124,000.
This is, of course, not a precise prophecy but a pattern-based speculation. In 2013, this number appeared at the absolute top of the bull market (Q4). In 2020, it appeared after a top in August, but the market wasn’t finished—it continued to climb in Q4.
Currently, Bitcoin has just formed a local top around the $124K level, highly consistent with this historical code. This signal is a stark reminder that we are already in the “high-risk zone” of this cycle. Market sentiment and capital are setting the stage for the final act.
Risk Management: As the Cycle Nears Its End, Is Your “Fleet” Still in Shape?
When you’re deeply engaged in this cycle game, especially when managing multiple token, NFT, or DeFi positions, the complexity of risk management multiplies exponentially. You might be holding simultaneously:
- Your core BTC position.
- What you believe are high-potential Altcoins.
- Tokens for volatile new projects.
- Multiple accounts across various exchanges or DeFi protocols.
This raises a crucial question: How do you ensure your “fleet” can navigate safely and efficiently, without being wiped out by a sudden market storm (exchange bans, project black swans, on-chain correlation)?
This is where a tool like FlashID can provide strategic value. It’s not a tool to make you “rich quick,” but an essential tool to help you “preserve your victory fruits” as the cycle concludes.
- Build Your Stealth Fleet: You can think of FlashID as creating a “stealth fleet” for your vast crypto asset portfolio. You can create a completely independent browser profile with a unique digital fingerprint for each project, exchange, or operational strategy. This means your BTC trading on Exchange A is technically isolated from your LP farming activities on Protocol B. This dramatically reduces the risk of a single compromised account affecting your core assets. At the peak of the last cycle, countless investors had their positions collectively liquidated by exchanges due to account correlation, watching their profits evaporate. FlashID exists specifically to eliminate this type of “single point of failure” risk.
- Automate Your “Logistics”: During periods of market volatility and frequent trend shifts, you need to monitor multiple markets and execute various strategies simultaneously. FlashID’s RPA (Robotic Process Automation) feature can automate these tedious logistical tasks. For example, you can script a task for your 10 test accounts to “claim airdrops” or “bridge assets” at set intervals, without manual logging. While you’re positioning your main portfolio for the Q4 move, let an AI handle these “chores,” freeing up your mental energy for more important market analysis and strategic decisions.
- Seamless Mobile Integration: When you need to manage multiple DeFi wallets or apps from your phone, the FlashID Cloud Phone (based on Android) comes into play. You can run a specific app or wallet in a completely isolated, realistic phone environment, separate from other apps and network settings on your physical device, ensuring security and scalability for mobile operations.
Ultimately, at the market’s peak, our task shifts from “how to acquire quickly” to “how to hold securely.” FlashID is your “safety pod” and “command center” on the road to the cycle’s top. It ensures that when the “Q4 carnival” arrives, you’re already in a safe position, orchestrating your resources methodically, rather than chaotically scrambling amidst the frenzy.
Frequently Asked Questions (FAQ)
Q: The article mentions that Bitcoin’s cycle “playbook” is highly repetitive. Does this mean the market is fully predictable? Should we operate entirely based on historical patterns?
A: Absolutely not. History repeats, but never by simply copying and pasting. Treat the historical playbook as a high-probability “weather forecast,” not an unbreakable “destiny decree.” Unknown variables (black swan events, regulatory shifts, technological breakthroughs) can alter the script at any time. Therefore, we should respect historical patterns as a framework to understand the likely direction of the market, but our final actions must be combined with real-time market signals and our own risk management principles.
Q: If Bitcoin effectively breaks below the 20-week MA but remains above the 50-week MA, what does that imply? What kind of strategy should we adopt?
A: This is typically interpreted as a “healthy correction” or “medium-term consolidation,” not the end of the bull market. It means the market needs time to digest profit-taking and regain upward momentum. In this scenario, a strategy could be: ① No Reduction of Position: As long as you hold the bullish lifeline (the 50-week MA), you shouldn’t operate with a bearish mindset. ② Swing Trading: Use the 20-50-week MA range for swing trading, but with strict stop-losses. ③ Focus on Leaders: In a sideways market, capital often flows back to the most liquid asset, Bitcoin. Pay attention to changes in Bitcoin Dominance.
Q: If Bitcoin’s price really tops out around the “$124,000” mark mentioned in the video and then starts to decline, how can we tell if this is the true cycle top or just a mid-cycle correction like in 2020?
A: The key to distinguishing these lies in time, magnitude, and market breadth. After hitting $12.4K in 2020, the market didn’t break the bear market support band and rallied quickly, fueled by new narratives (like DeFi Summer). A true cycle top, however, usually takes longer to form (e.g., head and shoulders top), is accompanied by huge volume and wild swings, and sees altcoins vastly outperforming Bitcoin (FOMO reaching its peak), followed by a broad-based, indiscriminate sell-off. Therefore, one must combine multiple indicators for a comprehensive judgment.
Q: A shift in focus toward the 50-week moving average (MA50) over the 20-week moving average (MA20)—is this a long-term change? What impact does this have on future technical analysis?
A: This may reflect an increase in market maturity and institutional capital. Longer-term moving averages like the 50-week can filter out short-term market noise and represent the consensus of longer-term investors. If this trend continues, future technical analysis will need to pay more attention to longer-term trends and support/resistance levels. For example, analysts might more frequently use “monthly chart” timeframes to assist in judging the signals of bull-to-bear or bear-to-bull transitions.
Q: What does “liquidity flowing back to Bitcoin” mean? What does it imply for the altcoin market?
A: This is often called “capital rotation.” In the late stages of a bull market and the early stages of a bear market, funds rotate from high-risk, volatile altcoins to the relatively lower-risk and most liquid Bitcoin. When Bitcoin launches its final parabolic move in Q4, it acts like a magnet, attracting most of the market’s incremental and existing capital. This causes alts to significantly underperform Bitcoin (seen in falling ETH/BTC and other pairs). Therefore, when you see Bitcoin continuing to rise while most alts stagnate, it often signals the final “Bitcoin-dominated” phase of the rally.
Q: Someone predicts that Ethereum (ETH) will rebound after its pullback but presents two scenarios: a quick dip or a prolonged consolidation. How can I prepare for both possibilities?
A: This tests an investor’s flexibility. If you lean towards the “quick pullback” scenario (“rip off the band-aid”) and have a higher risk tolerance, you could consider dollar-cost averaging a position as the price approaches the 21-week MA. If you prefer the “prolonged consolidation” scenario or a more conservative approach, you could temporarily park your capital in a more stable asset like Bitcoin or patiently wait for ETH to show clear signs of stabilization (e.g., a breakout on high volume from its range) before entering. Remember, there are no perfect predictions, only prepared strategies.
Q: Why would I need to use FlashID during a bear or sideways market? If the market is bad, do I still need to manage so many accounts?
A: It is precisely during periods of market calm or a bear market that it becomes crucial to prepare for the next bull run. This is like a farmer sowing seeds in winter for the autumn harvest. At this time, you can:
- Test New Strategies: Use FlashID’s multi-account environment to test new strategies with small capital, accumulating experience for large-scale operations when the bull market arrives.
- Claim Airdrops/Whitelists: Many new projects airdrop during bear markets to build their user base for the future. FlashID’s RPA can help you participate in these activities efficiently and securely.
- Safely Engage in High-Risk Projects: Split your “ammunition” into multiple parts and test different high-risk plays in isolated environments, avoiding putting all your eggs in one basket.
- Staking: Even in a bear market, many people need to manage multiple wallets, participate in Staking, and handle cross-chain operations. FlashID ensures the independence of these actions.
Q: If I use FlashID to manage my crypto accounts, can it 100% guarantee my accounts won’t be banned?
A: No tool can provide 100% absolute assurance, as risks come from various sources (project risk, exchange risk models, user error). However, FlashID drastically reduces the risk of “account correlation,” which is the primary cause of mass bans. By creating a unique digital fingerprint for each account, you appear as “completely different” users to the platform. This physical-level isolation is the most effective defense against correlation risk. It reduces risk from “systemic” to “ad-hoc,” providing you with far greater security than the average user.
Q: As a cryptocurrency investor, besides using tools, what core “risk awareness” must I possess?
A: Technical tools are the shield, but risk awareness is internal strength. Core risk awareness includes:
- Don’t Go All-In: Always maintain a portion of your portfolio in lower-risk assets (stablecoins, treasuries) to ensure your and your family’s quality of life is not impacted by market volatility.
- Understand What You’re Investing In: Don’t invest in projects you don’t understand, especially those with complex mechanisms and opaque teams.
- Practice Position Sizing: Even for your most bullish investments, don’t make the position too large. Learn to diversify—across assets (BTC, ETH, others), across sectors (DeFi, GameFi, AI), and over time (dollar-cost averaging).
- Resist FOMO: Market sentiment is your biggest enemy. When everyone around you is talking about a project and getting rich, it’s often when the risk is highest. Learn to think independently.
Q: As AI applications in crypto become more widespread (e.g., AI prediction markets, AI quantitative trading), how will this impact traditional cycle analysis? How should I adapt?
A: AI, as a powerful tool, will undoubtedly deepen our understanding of market cycles and may even uncover subtle patterns that are hard for humans to spot. However, it cannot change the fundamental driver of the market: human nature (greed and fear). Therefore, AI is more of an “enhanced analyst,” potentially providing more precise entry/exit points, but it cannot eliminate risk. As investors, we should embrace technology, using AI’s insights as a reference for our decisions, but the final risk assessment, position sizing, and emotional control must still be done by us humans. Staying curious, leveraging tools, but never blind to any one tool is the best practice for human-AI collaboration in investing.
You May Also Like